
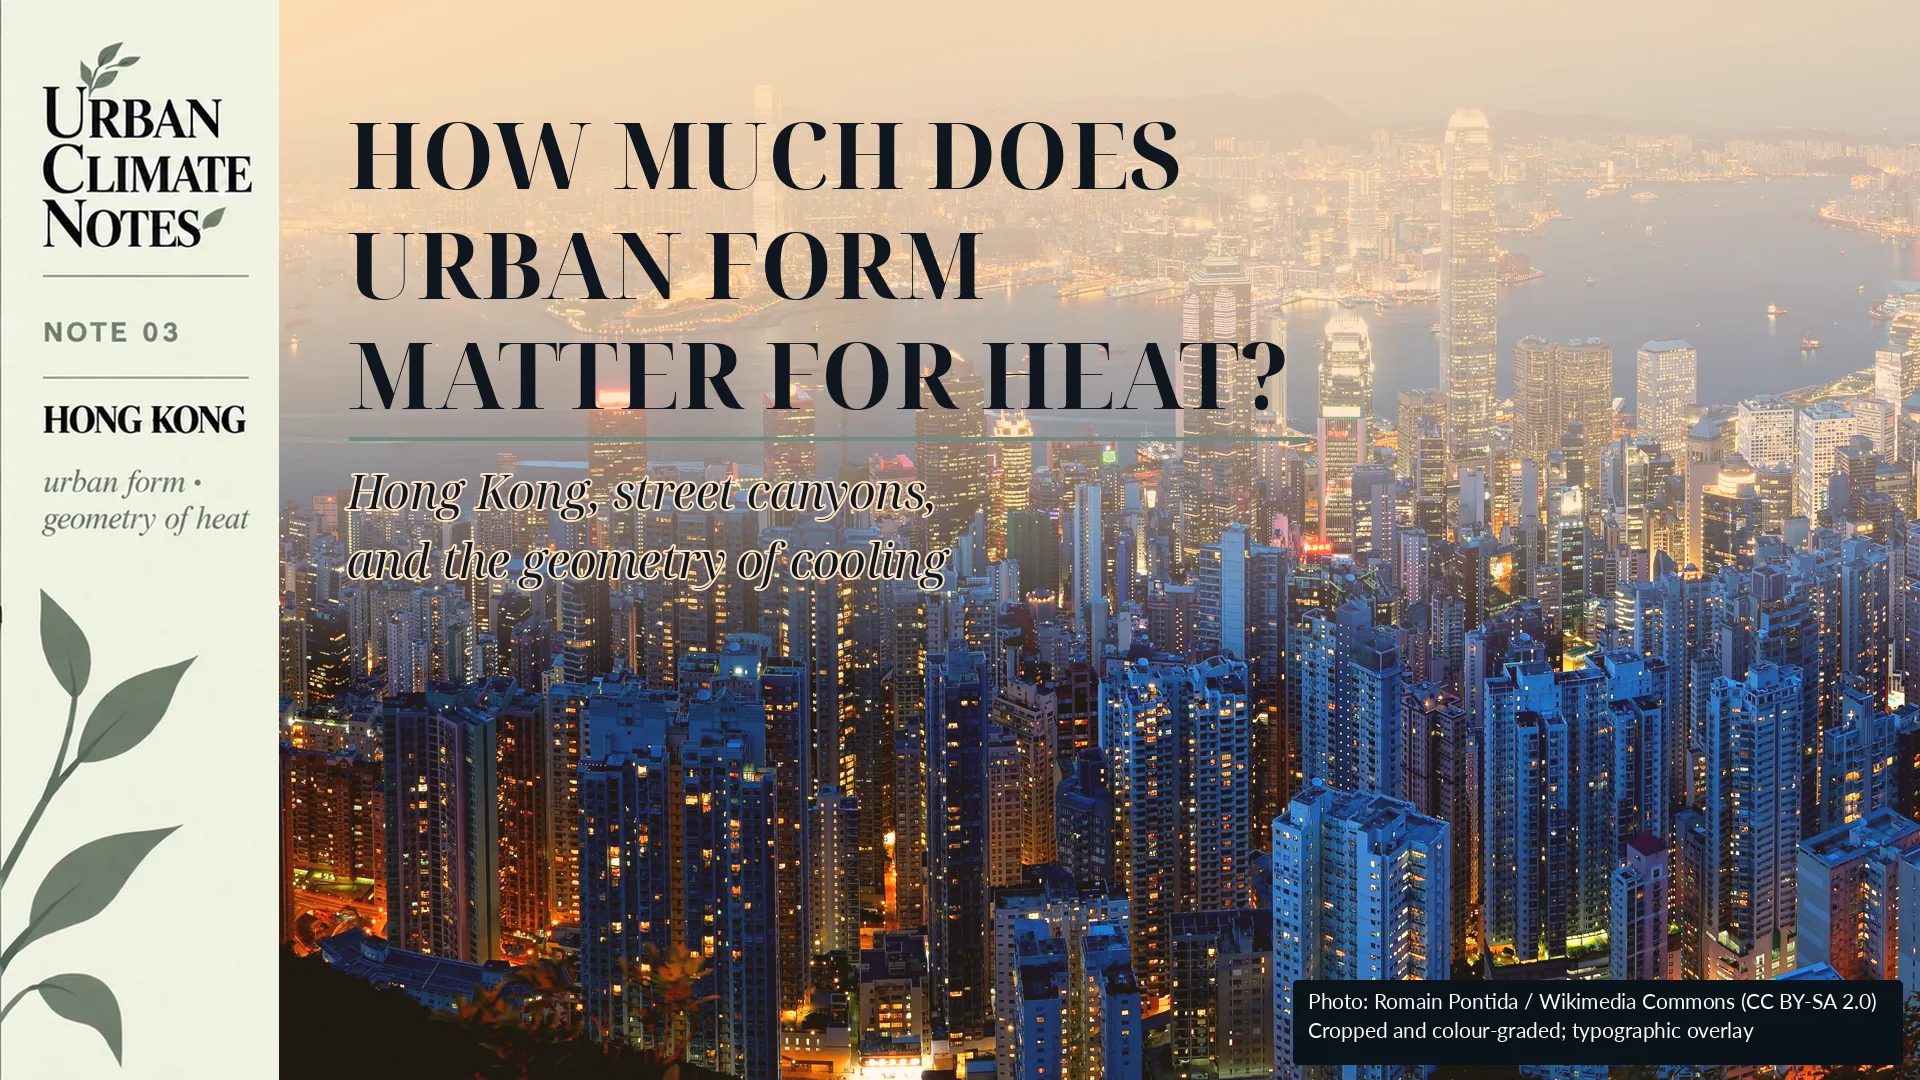
前人種樹,後人乘涼。
Those before us plant the trees; those who come after enjoy the shade.
There is an old Chinese saying about one generation planting trees so that another can sit in their shade.
It is not a saying that originated specifically in Hong Kong, but it remains familiar there. In 2018, the Hong Kong government used the same expression while discussing long-term urban greening.[1]
For urban climate, the metaphor is unusually literal.
A tree planted today may shade a pavement decades from now. Streets and buildings can last just as long. Their height, spacing and orientation influence where sunlight reaches the ground, where shade falls, how much of the sky remains visible and how freely air moves through the city.
Hong Kong makes these relationships particularly visible.
Its compact vertical form can change considerably within a short walk. One street may open toward the sky and prevailing wind. A few blocks away, another may sit between closely spaced towers.
The weather forecast can be identical.
The thermal conditions at street level do not have to be.
Two streets, one city
Imagine two streets during the same hot afternoon.
One is relatively open. Buildings are lower or farther apart, more sky is visible and the ground receives more direct solar radiation.
The other sits within a deep street canyon. Tall buildings shade much of the street for part of the day, but they also restrict its exposure to the sky and alter airflow.
Calling the second street simply "denser" does not describe these differences very well.
Urban morphology deals with the physical configuration of the city: building height, building coverage, spacing, street width, orientation, vegetation, open space and the three-dimensional relationships among them.
Two neighbourhoods can therefore have similar development densities and still produce very different urban environments.
For heat, those differences matter.
Shade does not tell the whole story
Shade is one of the most immediate thermal effects of urban form.
A building that blocks direct sunlight can reduce solar exposure at street level. During a hot afternoon this can make a substantial difference to the conditions experienced by pedestrians.
But shade describes only part of the urban energy balance.
Buildings, pavements and other surfaces absorb energy during the day and release some of it later. Their surroundings influence how that heat is exchanged with the atmosphere.
The Hong Kong Observatory identifies several mechanisms behind the urban heat island effect, including heat stored in buildings, reduced exposure to the sky, anthropogenic heat and lower wind speeds in densely developed areas.[2]
The Observatory also describes Hong Kong's urban heat island as primarily a nighttime phenomenon.[2]
That makes the geometry more complicated than a simple choice between shade and sun.
A street canyon may protect pedestrians from direct solar radiation during part of the day while also restricting longwave heat loss or ventilation after sunset.
A shaded street is therefore not necessarily a street that cools efficiently.
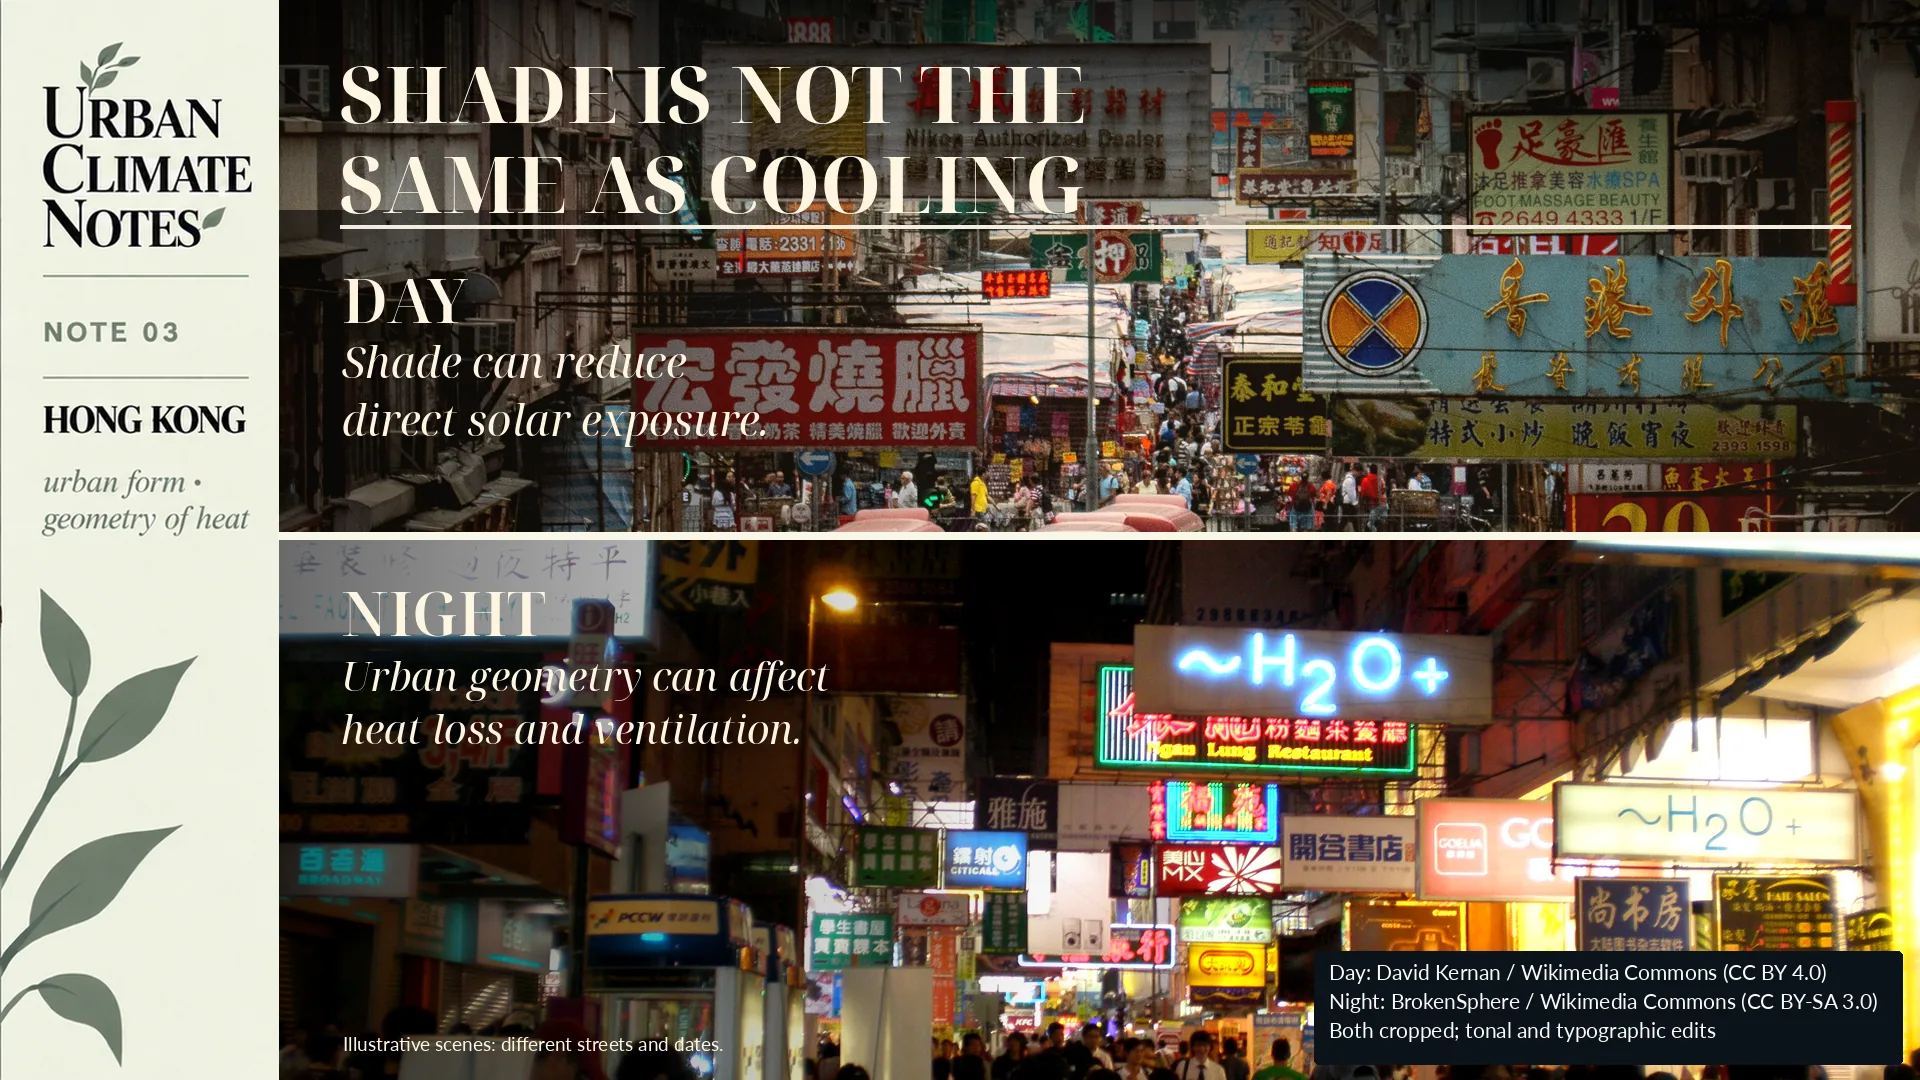
The same geometry can produce useful daytime shade while affecting radiative cooling and ventilation after sunset.
Looking at the sky from the ground
One way to describe this geometry is the Sky View Factor, or SVF.
Stand in the middle of a street and look upward.
In an open area, much of the hemisphere above you is visible. The SVF is relatively high.
Between tall, closely spaced buildings, the visible opening becomes smaller. The SVF is lower.
The concept is simple. Its relationship with urban temperature is not.
A 2024 Hong Kong study by Xu and colleagues combined remotely sensed land surface temperature with mobile air-temperature observations. The researchers examined variables including floor area ratio, building coverage, SVF, mean building height, road density and vegetation coverage.[3]
Their results showed that the morphology variables associated with daytime thermal conditions were not the same as those associated with nighttime conditions. At neighbourhood scale, two-dimensional surface characteristics were particularly important during the day, while both two-dimensional and three-dimensional morphology became relevant at night.[3]
Another Hong Kong study published in 2024 examined 4,474 street-level air-temperature measurements and compared conventional regression with Random Forest and artificial neural network models.[4]
The relationships between urban form and localized air temperature were predominantly nonlinear. Random Forest and the neural-network model also predicted the observations more accurately than linear regression.[4]
This matters because urban climate relationships are often reduced to statements such as "higher buildings make streets hotter" or "a lower SVF increases temperature."
The evidence from Hong Kong does not support one rule that works at every time and under every condition.
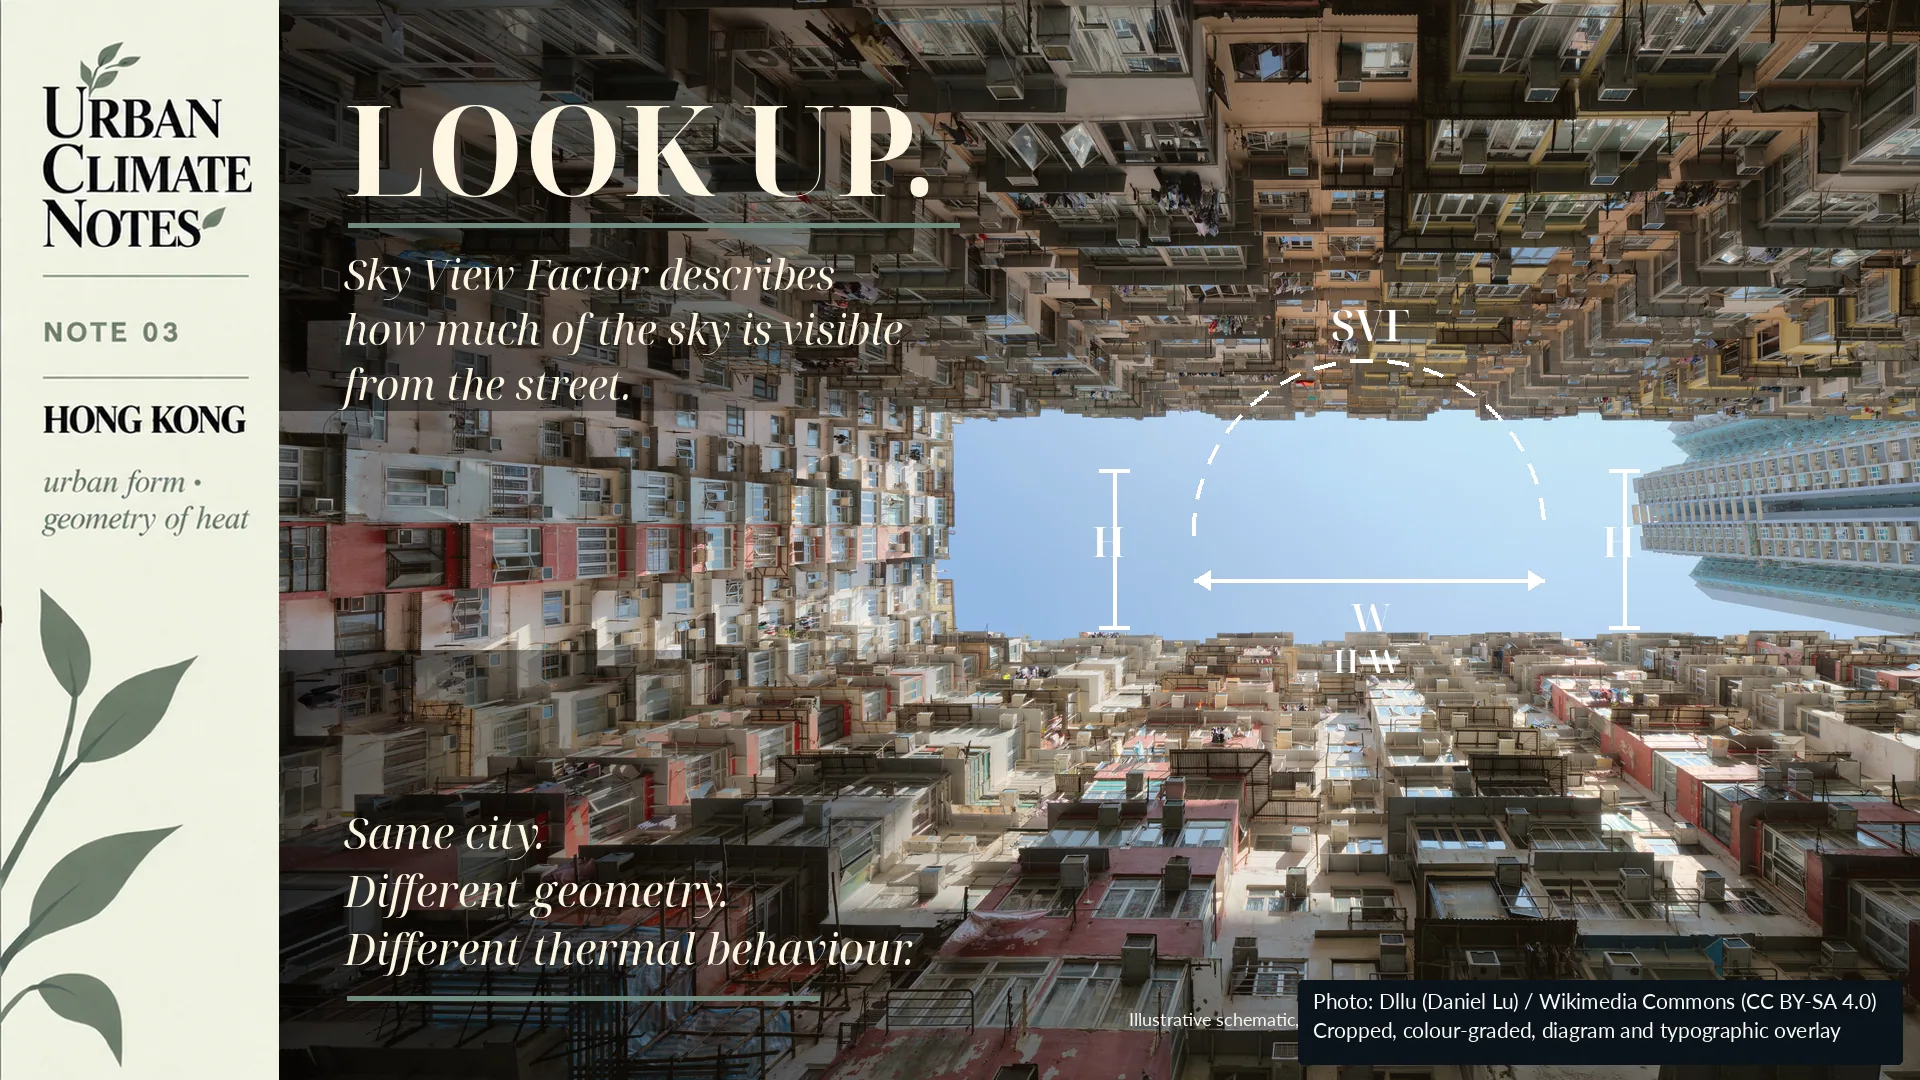
Building height, street width and sky exposure describe different aspects of urban form. Similar density does not necessarily mean similar geometry.
The same geometry can behave differently at different times
A recent study led by Sze Ping Hui examined daytime and nighttime land surface temperature in Hong Kong during both hot and cold periods.[5]
Sky View Factor emerged as the most influential morphology indicator in their model, but its relationship with land surface temperature changed with season and time of day.
The study identified different nonlinear thresholds for January and July, and for daytime and nighttime conditions.[5]
Building height showed the same general problem: its thermal relationship could not be represented adequately by one coefficient or one universal threshold.
This does not mean that SVF or building height are unreliable planning variables.
It means that their interpretation depends on context.
Time matters.
Season matters.
So does the temperature variable being measured.
How far does the influence of a street extend?
Urban heat research is also moving toward much finer spatial scales.
A recent study in Kowloon combined vehicle-mounted measurements of near-surface air temperature, helicopter-derived land surface temperature and Google Street View imagery.[6]
The researchers examined how the thermal influence associated with individual streetscape elements persisted as the measurement vehicle moved through the city.
Under the early-evening conditions they studied, the combined warming influence associated with land surface temperature, roads and buildings extended laterally up to roughly 40 metres. The cooling influence associated with vegetation was much more localized, within roughly 15 metres.[6]
These numbers are interesting, but they should not be converted into universal design rules.
They describe a particular city, method and set of measurement conditions.
The more useful finding is spatial.
Thermal influence did not stop at the edge of an individual parcel or feature.
That raises a planning question about continuity. A short segment of planting may behave differently from a connected green corridor. The same may be true for paving materials, building façades and ventilation routes.
From heat maps to urban form
There is another complication.
A satellite can identify a hot surface. A weather station measures the temperature of the air around its sensor. A mobile observation describes conditions along a particular route at a particular time.
These measurements are related, but they do not describe exactly the same thing.
A 2026 Hong Kong study by Adeniran and colleagues examined daytime and nighttime relationships between air temperature and surface temperature across land-use categories and Local Climate Zones.[7]
Surface temperature was an important predictor of air temperature, but the models improved when land use, urban configuration and time of day were included. Compact built environments, vegetation and different land-use classes contributed differently to the observed thermal patterns.[7]
The implication is important for urban planning.
A heat map is not self-explanatory.
Before using it to diagnose a neighbourhood, we need to know what was measured, at what scale, at what time and under which urban conditions.
What does this mean for planning?
Urban form is difficult to change after it has been built.
Street widths, building spacing, height patterns and the arrangement of open spaces can remain in place for decades.
Their thermal consequences therefore deserve attention before the next heatwave, and ideally before construction.
This does not lead to a simple argument for lower density or shorter buildings.
Hong Kong is a useful example precisely because its evidence resists that kind of conclusion.
The more useful planning question is narrower:
How does a particular urban configuration affect solar exposure, ventilation, heat storage and nighttime cooling under the climatic conditions of that place?
The answer may influence decisions about street proportions, setbacks, building spacing, orientation, vegetation, open-space networks and ventilation corridors.
These decisions are usually described in planning language.
Their consequences are partly climatic.
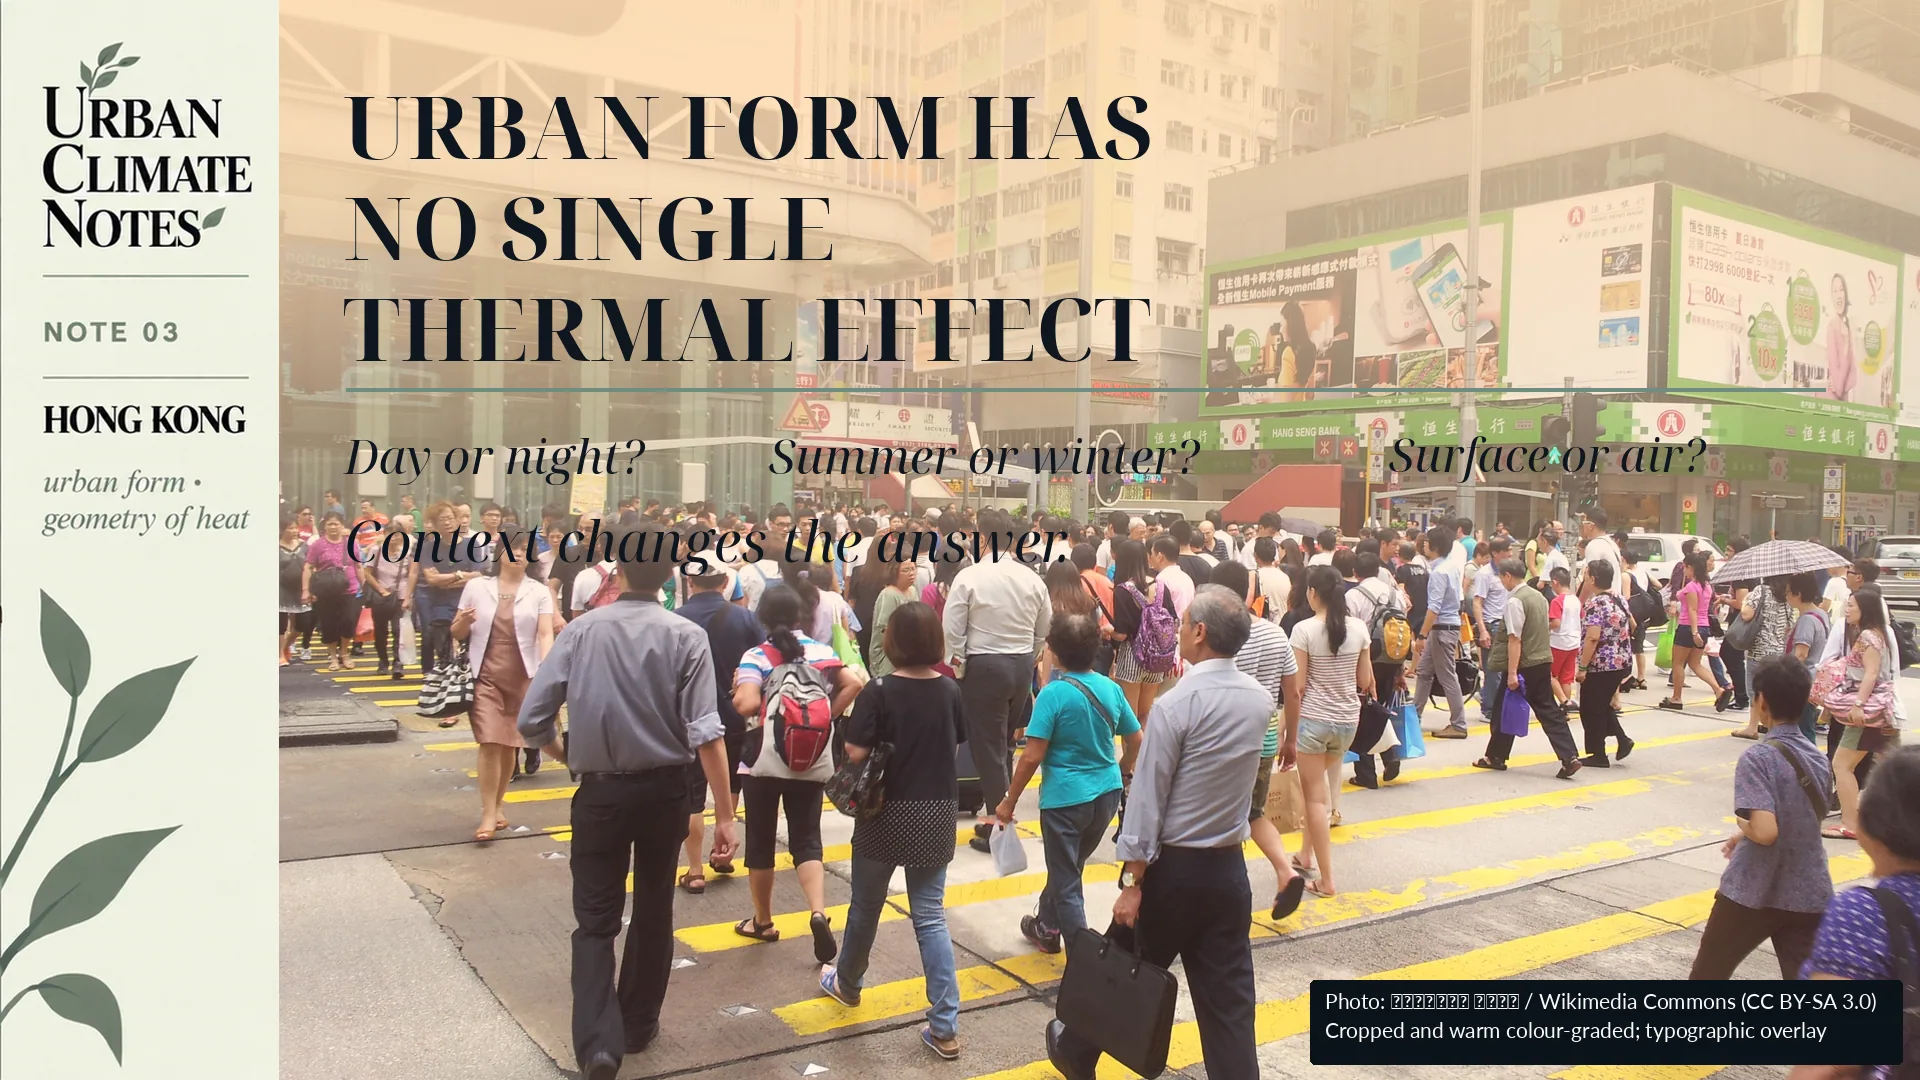
Urban morphology interacts with time of day, season and the temperature variable being measured. A single geometric indicator cannot describe every thermal condition.
The streets we leave behind
The old saying is worth returning to:
前人種樹,後人乘涼。
Those before us plant the trees; those who come after enjoy the shade.
Future residents will inherit the trees we plant.
They will also inherit the buildings around them, the width of the streets, the gaps between towers and the amount of sky that remains visible from the pavement.
Urban form is therefore more than a record of how a city grew.
It also becomes part of the climatic environment experienced by the people who come after us.
Next: What temperature are we actually measuring?
Satellites have transformed urban climate research.
They allow us to observe large areas repeatedly and to compare thermal patterns across cities and through time. Much of my own research relies on this capability.
But thermal satellite sensors primarily tell us about land surface temperature.
People live in the air above those surfaces.
The two are connected, but they are not interchangeable.
The next Urban Climate Note will examine that distinction:
If a satellite says a neighbourhood is hot, does that mean the air there is equally hot?
Sources
[1] Development Bureau, Hong Kong SAR Government. (2018). 持續綠化都市 美化生活環境 [Continuing urban greening and improving the living environment].
[2] Hong Kong Observatory. Urbanization Effect. Climate Change, Hong Kong Observatory.
[3] Xu, Y., Yang, J., Zheng, Y., Li, W., et al. (2024). Impacts of two-dimensional and three-dimensional urban morphology on urban thermal environments in high-density cities: A case study of Hong Kong. Building and Environment, 252, 111249. DOI: 10.1016/j.buildenv.2024.111249.
[4] Tian, L., Hao, T., He, X., Chan, I., Niu, J., Chan, P. W., Ng, W. Y., & Huang, J. (2024). Examining the non-linear relationship between urban form and air temperature at street level: A case of Hong Kong. Building and Environment, 264, 111884. DOI: 10.1016/j.buildenv.2024.111884.
[5] Hui, S. P., Liu, Y., Mohammad, P., & Weng, Q. (2026). Assessing the diurnal relationship between urban morphology and land surface temperature in a highly dense city: A case study in Hong Kong. Remote Sensing Applications: Society and Environment, 41, 101858. DOI: 10.1016/j.rsase.2025.101858.
[6] Zou, K., Wong, M. S., Nazeer, M., Yu, X., Tan, G., Hou, H., Yang, J., & Chan, P. W. (2025). Unravelling the street thermal features network and spatial visual thermal inertia: A study in Hong Kong. Sustainable Cities and Society, 136, 107054. DOI: 10.1016/j.scs.2025.107054.
[7] Adeniran, I. A., Nazeer, M., Wong, M. S., Yang, J., & Chan, P. W. (2026). Diurnal Air–Surface Temperature Dynamics in Hong Kong: An Analysis Across Land Use and Climate Zones. International Journal of Climatology, 46(6), e70297. DOI: 10.1002/joc.70297.